Most investors monitor risk on an infrequent, daily, weekly or even worse, monthly basis. But events in today’s markets unfold over minutes and hours. A system that protects against such events needs to monitor risk on a minute by minute real-time basis. This is a challenging problem for older databases with outdated modes of computation, but modern vectorized solutions like Kinetica can crunch massive amounts of data and handle financial risk management in real-time.
Archegos Saga
On Friday, March 26, 2021, Archegos Capital Management defaulted on loans that backed its $100 billion portfolio. Over the course of just a few days, Credit Suisse Group AG, lost $4.7 billion while Nomura Holdings Inc. lost $2 billion and several other investors lost hundreds of millions of dollars. The founder Bill Hwang went from being one of the richest investors on Wall Street to losing $20 billion in just a couple of days.
This is one of the fastest (and biggest) financial wipeouts in the history of Wall Street but it certainly is not the only one in recent memory. For instance, the GameStop short squeeze event- where hedge funds with short positions on GameStop lost billions over a few days – happened just a couple of months before Archegos, in January, 2021.
Both of these events have one thing in common – they happened really fast and caught banks off guard. Leaving aside some of the regulatory and risk management issues, this can be boiled down to a technology problem.
About this demo
In this demo, we set up a real-time risk monitoring system with Kinetica that alerts investors as and when portfolio values fall below certain thresholds.
This is a really simple demo that solves a challenging problem. The steps broadly are the following.
- Plug into streaming and static data sources and load the data into relational tables in Kinetica
- Setup a continuously updated risk monitoring view that combines portfolio holdings data with real time stock prices
- Setup up alerts via webhooks and/or sink the data to a Kafka topic
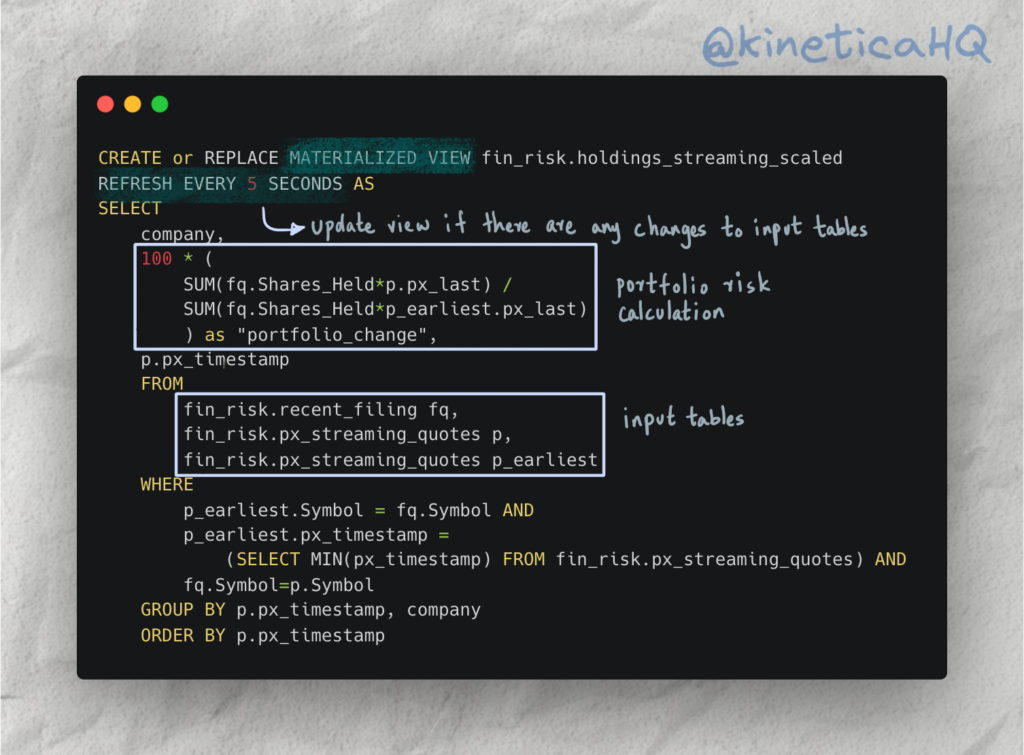
All of this is done with just a few simple SQL statements and relational tables. For instance, check out the query below that we use to set up a continuously updating view on portfolio changes.

It calculates a relatively simple measure of risk by taking the ratio of the current portfolio value to the earliest available portfolio value. Any time new records are added to the input tables in this query the view gets refreshed within 5 seconds. This means that any volatility beyond acceptable thresholds will trigger an alert within 5 seconds regardless of the size and scale of the data.
While the query itself is simple, the real technological challenge is deploying this on the massive distributed scale that Kinetica can.
Try it out yourself
Deploy Kinetica
You will need an instance of Kinetica to run this demo. There are three options (in order of preference):
- Kinetica Cloud: The cloud version of Kinetica is free for small scale projects and comes with Kinetica’s interactive notebook environment called Workbench. This is the preferred mode for deploying this demo.
- Developer Edition: The developer edition of Kinetica is a containerized application that can be run on your personal computer. Developer edition does not currently include Workbench.
- On-premise version of Kinetica: Please reach out to support@kinetica.com for a license.
Access demo files
You can access the relevant material for the demo from our examples repo here.
Workbook files can only be loaded if your version supports workbench. So if you are on a cloud instance of Kinetica, you can download the workbook JSON file and import it.
If you are on a version of Kinetica that does not support workbench, you can execute queries in the included SQL file using the query interface on GAdmin (the database administration application).
Contact us
We’re a global team, and you can reach us on Slack with your questions and we will get back to you immediately.

