With the vast volume of cellphones, packages, vehicles, purchases and other items moving through time and space, a good foundational understanding of how spatial data can be used is increasingly valuable. This post provides an overview of the different types of spatial data and how you can make the most of yours.
What is Spatial Data?
Spatial data can be split into two categories: vector and raster. Vector data uses points, lines, and polygons to represent features in the world. Vector data consists of coordinates, or series of connected coordinates to determine the location of features. In addition to the coordinates, important metadata is stored about each feature, like its name or other properties.
Raster data, on the other hand, uses images to summarize geographic information in a grid of pixels applied to the earth’s surface at a particular scale. Each pixel represents a geographic “bin” that summarizes a value for the area, like temperature. Rasters can then be created at different resolutions depending on the observational data available. Some may contain very granular cells of data, while others are more coarse and aggregated. Raster data includes metadata that orients the grid to the map, including a Spatial Reference System, projection, boundaries, and position.
Why Different Approaches to Spatial Data?
Vector and raster formats are optimized for storing different types of data, and therefore supporting different types of analysis. Raster data is better suited for storing continuous and thematic information about the earth, like elevation and soil type, respectively. Because raster data can be collected using aerial and satellite imagery using various forms of optical sensors, it is a cost-effective format to cover large swaths of geography without the need for many smaller sensor readings, like IOT devices. Raster cannot, however, capture more detailed information available in vector data. For example, raster is not well suited for storing GPS transponder data, where properties like speed, heading, date and time, and vehicle ID are important and should be captured for many vehicles, simultaneously, through time.
Vector data, on the other hand, is well-suited for storing detailed information about features. Points can be captured and stored with corresponding state information at a point in time, which is useful for time-series analysis. Vector data has a very high resolution, and it is therefore a more accurate format for storing boundary information, like state lines, voting districts, and building outlines. Vector data is well-suited for geometric analysis and comparison. For example, points can be checked to determine if they fall within the boundaries of a polygon, or several polygons can be combined to produce a larger one.
The analysis you intend to perform will dictate the types of spatial data you will need to collect and use. In general, if your analysis deals with summarizing changes on the earth’s surface (temperature, elevation, vegetation, etc.), you will most likely need raster data to perform the analysis. Otherwise, if you are interested in analyzing the properties of individual objects or features through space and time, you will most likely need vector data to support your analysis.
What Produces Spatial Data?
Spatial data is produced by many means:
GPS Transponders and Cell Phones
GPS information is now widely collected via cell phones and GPS transponders. Apps on your phone routinely collect GPS information to serve location-based results — like finding the nearest restaurant or gas station.
IOT Sensors
IOT sensors, like parking meters or point of sale systems increasingly capture spatial information, which helps operators understand how geography impacts other transactional data captured by the device.
Satellites, Manned Aircraft, and UAVs
Aerial imagers capture data about the earth’s surface using an array of sensors including optical, infrared, and LiDAR. Satellites capture information about the earth’s surface on a continual basis, while aircraft can be used periodically to capture high resolution images for use cases like wildfire reporting and management.
Cameras / Video Devices
Video cameras are now capable of recording videos and embedding spatial information. As cameras observe behavior in the natural world, computer vision algorithms can be used to classify visible objects. This is useful in a variety of applications like smart cities, where cars can be routed to the nearest empty parking spaces captured via a video stream.
Human-input/Hand-drawn
Some data is hand-drawn and input by humans. Administrative boundaries like neighborhoods, city limits, and voting districts have special meaning and are dictated by policy, rather than spatial attributes. Government and commercial entities often manage these datasets and update them on a regular basis for their analysis. Some datasets use the power of crowd-sourcing to maintain their accuracy, like the Open Source Map (OSM) project, which relies on community contribution to maintain road network data worldwide.
Vector Data Overview
Points
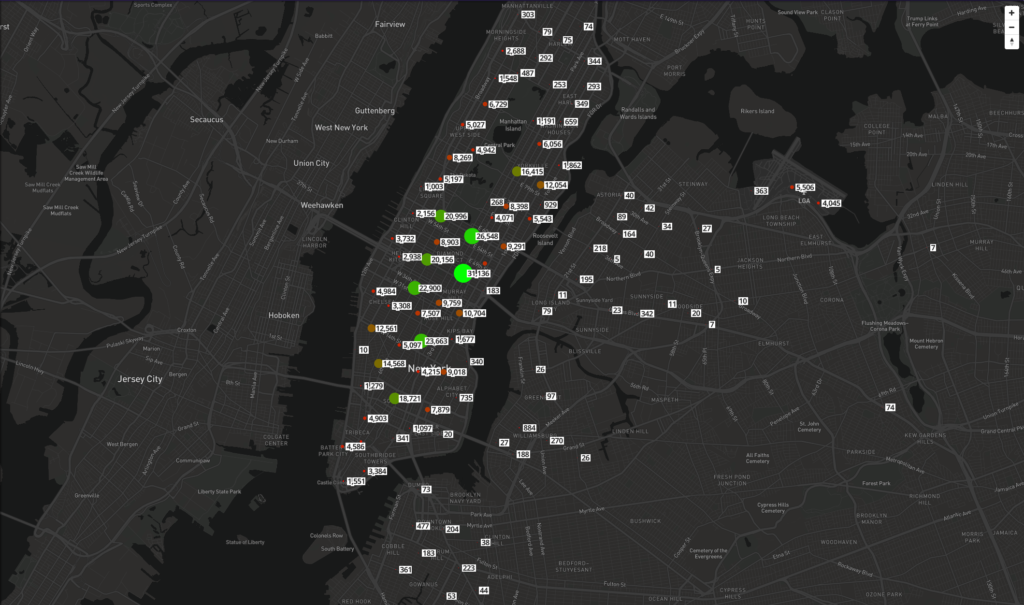
Point data consists of one pair of latitude/longitude coordinates. For example, your phone can capture your GPS location on the earth and return your latitude and longitude, which can be stored with other metadata about your phone, like your phone number and current cell coverage quality. Several points can be stored together in the same record with a MultiPoint geometry type.
Lines
Lines are captured in the form of a series of connected coordinates. This allows us to store information like the freeform path you took to get from point A to point B, or well-defined paths like a road network. Several lines can be stored together in the same record with a MultiLine String geometry type.

Polygons
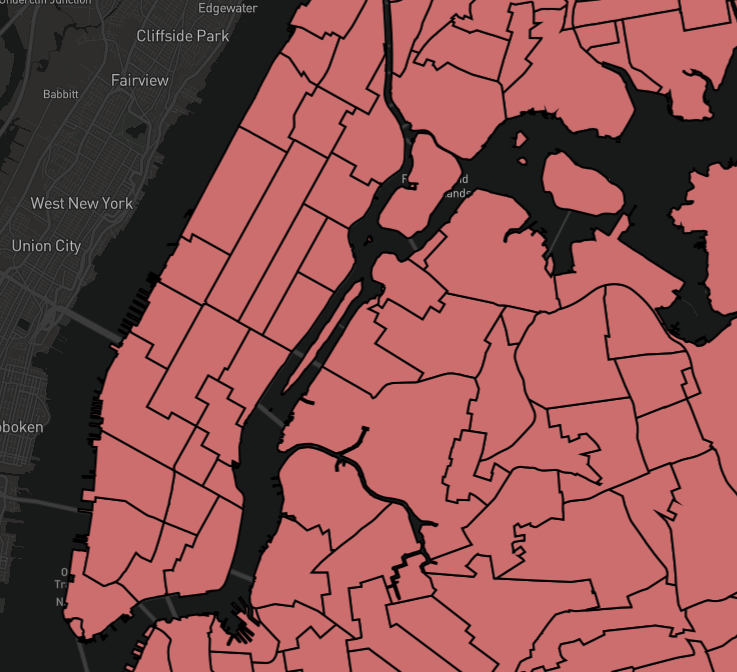
Polygons are a series of connected coordinates that are closed — when the first and last coordinate are the same. Polygons can have holes in them as well. Polygons represent real-world boundaries, like state borders, voting districts, or even the outline of a facility. Polygons are often used to generalize granular data, like points, to make maps easier to read and understand. Polygons can also take more complex forms, like MultiPolygons, where several polygons are contained in a single record.
Geometry Collections
Geometry collections allow users to store several different types of geometry in a single record.
Raster Data Overview
There are also a couple types of raster data:
Thematic (Discrete)
Values are used to represent categorical spatial features, like land-use or soil type. This data is often captured from optical sensors in the real world, but it can also be synthetically generated by other processes. Raster data is Inherently categorical in nature.
Continuous
Often represents real-world phenomena, like temperature, elevation, spectral (satellite/aerial imagery).
Benefits of Spatial Data
Spatial data is important because it provides a more complete context when making business-related decisions. For example, choosing to place a new store location in an upscale part of town may sound like a no-brainer, but there could be significant revenue implications based on spatial factors like the distance to competitors and public transit options, and the proximity to households that make more than $50k per year.

Location data reveals real-world patterns and behaviors, like which roads someone drives more often than others, or how someone’s location affects their buying decisions. When combined with time-series information, we are able to see how these outcomes are influenced over time, and the path someone took to make a decision. In fleet management, vehicles are tracked through space and time to report on the vehicle’s current status and warn operators of dangerous conditions or driving behavior. Without a spatial context, operators might only know a vehicle’s speed. They can see the vehicle is traveling 70 mph, but they do not know if it is traveling safely on an interstate, or unsafely in a residential zone.
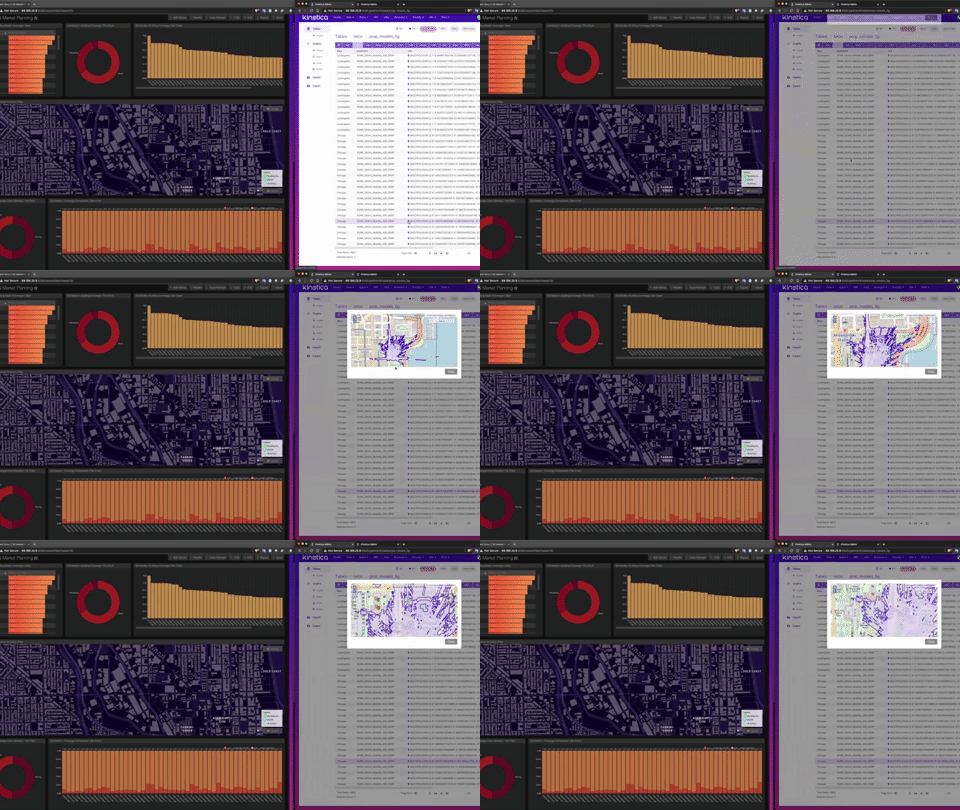
Equipped with this data, businesses can react to fluctuating market conditions faster and make better decisions. Imagine a restaurant that can offer a coupon to a regular customer that is currently in the area looking for food, as opposed to emailing them a coupon every week and hoping they remember to use it at the right time. Spatial and time-series data is what makes these types of offers possible. Gartner predicts that by 2022, 30% of customer interactions will be influenced by real-time location analysis.
Analyzing Spatial Data
There are several approaches and technologies available to help you analyze spatial data:
Spatial Databases
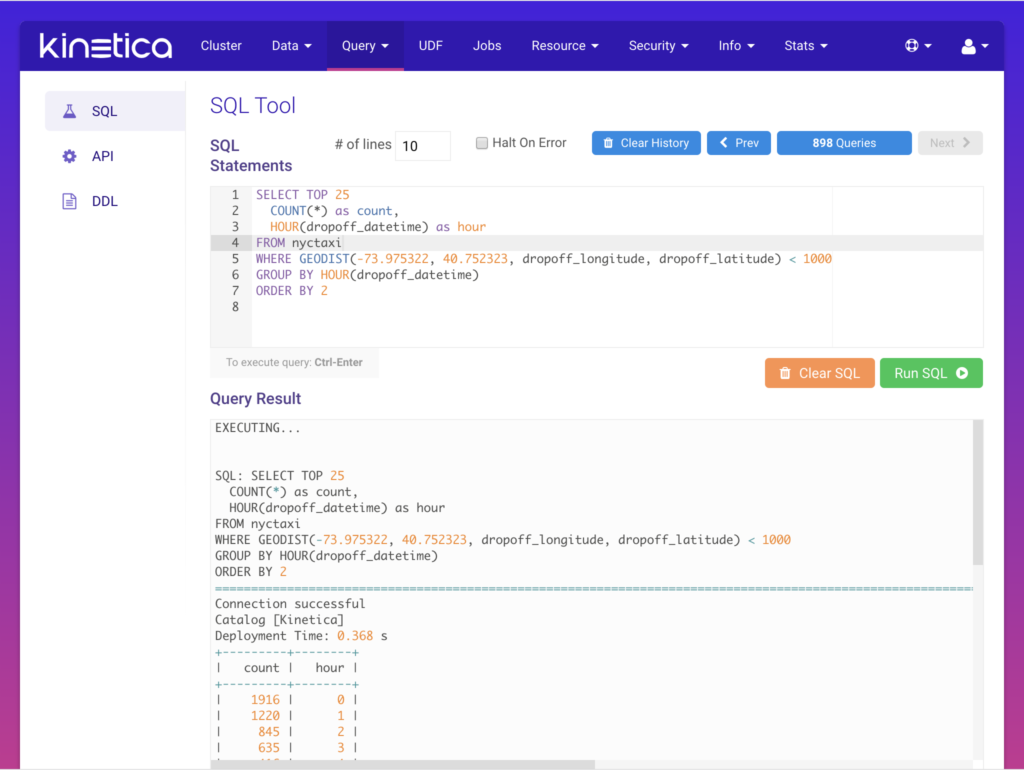
Spatial databases allow users to craft SQL queries that include spatial type functions. One benefit to using a spatial database is that the data is co-located with the processing, and data does not have to be moved into another platform for analysis. Spatial databases often support a large number of spatial functions, in addition to the common SQL functions of other databases. Geo filters can be applied that eliminate unwanted features that share a common relationship. For example, users can filter out all points that fall outside of a particular state’s border. Spatial databases can also perform geo-joins, where attributes from two separate Spatial data tables are merged together based on a relationship to one another. Users do not need a deep knowledge of programming languages to create queries, and they can rest assured that the data is secured using the role-based authentication system built into the database.
Graph Analysis
Graph analysis uses specialized data structures to model data in graph form – many nodes connected together by edges. Once graphs are created, algorithms (solvers) or queries can be run to create a set of traversal instructions for the graph.
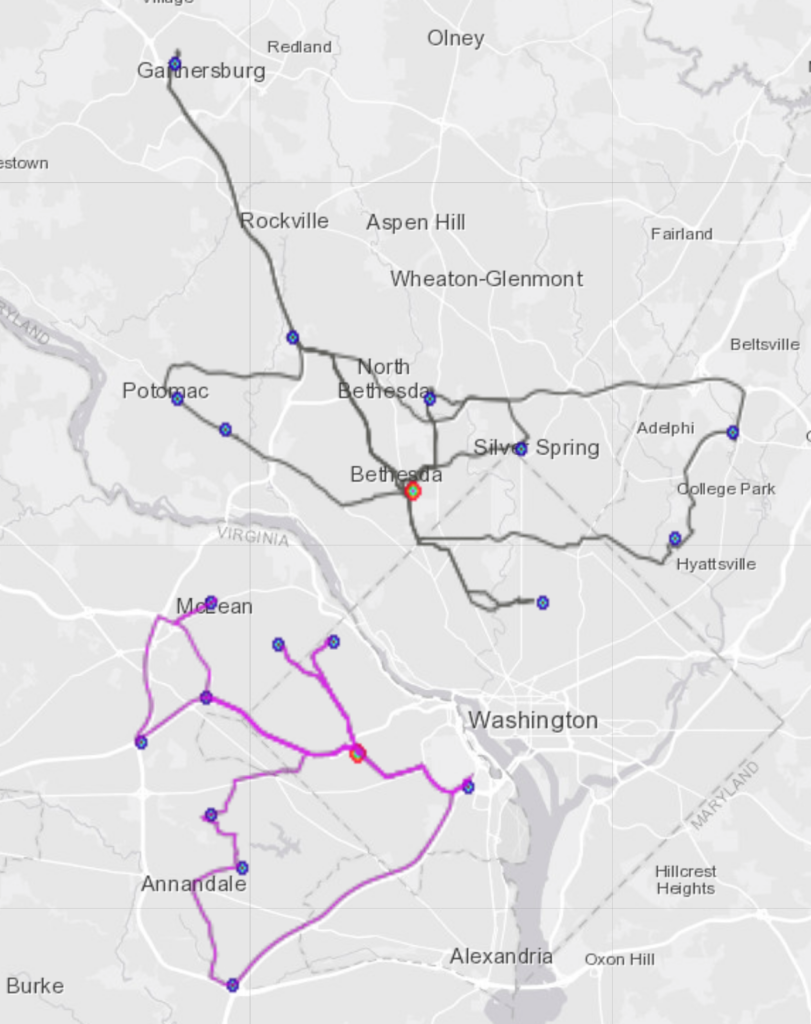
Graph analysis helps users construct spatial data in terms of their relationships to one another. This is especially important for road network data. Road networks can be abstracted into a series of edges that represent each road segment. Each edge is composed of two connected spatial points. In addition to the location data, each road segment can have other attributes, like a street name, speed limit, and more. Graph databases are often used in a spatial context to solve routing problems, like finding the shortest path, a round trip route (traveling salesman), or the centermost node in a graph network (centrality).
More complex routing algorithms may also be used, like multiple-supply-demand, which matches warehouses, inventory, drivers, and customers based on the most optimal arrangement. Another function a graph database can perform is map matching. Map matching takes noisy GPS points and uses advanced analysis, like a hidden markov chain, to accurately place the GPS points on the road network with a high degree of accuracy, thereby producing a real-world representation of the route traveled by a vehicle.
Specialized Spatial and Location Intelligence Tools
Several vendors offer specialized tools for performing spatial analysis and location intelligence, like Esri and Carto. The tools that these companies provide are purpose-built to perform spatial analysis, and are widely used by GIS professionals. While the most feature-complete of these approaches to analyzing location data, they often come with expensive subscription fees.

Spatial API Services
Some companies offer a managed service and API, to which users can send location data or queries. These solutions help users derive value from their data quickly, and reduce the cost and complexity of managing a spatial solution themselves. One downside of using a spatial service and API is that the data is not co-located with the processing, which requires all of the data to be sent from the storage solution to the service, and possibly back again. This introduces unwanted latency in the analysis pipeline and may impact the viability of the analytic solution.
Spatial Programming Libraries
Programmers may conduct spatial analysis with batches of data and open source spatial libraries. Many libraries are freely available, but require programming expertise in order to analyze spatial data. Programming libraries may be an attractive alternative to spatial databases when the required analysis is well-defined and does not change often. Due to the complexity of writing and deploying code, they are not particularly well-suited for conducting ad-hoc analysis, or for direct use by analysts and other business personas.
Visualizing Spatial Data
Spatial data is often visualized on a map using specialized software. Two paradigms exist for visualizing spatial data:
Client-side Rendering
Client-side rendering solutions move data to the client’s computer to be visualized. They are dependent on the available resources of the user’s computer. These solutions can be deployed in desktop software, or in a web browser through JavaScript, and they produce beautiful data visualizations that can help users better understand their spatial data. However, client-side spatial visualizations are often limited by the time it takes to send spatial data to the client, and the rendering power of their desktop hardware or web browser. As a result, client-side rendering solutions often cannot render more than 100k features simultaneously, and may struggle to produce timely results at this end of the scale. Many legacy GIS tools may only be able to render a few thousand features before degrading in performance.
Server-side Rendering
Server-side rendering solutions are a relatively new offering that allows map visualizations to be created from server-side data and powerful rendering hardware. Clusters of servers, that house the spatial data, can divide and render spatial imagery using many GPUs to create the resulting images in milliseconds. The images can then be returned to the client through an OGC Compliant Web Map Service, or WMS for short. Through a WMS, rendered images are sent to the client on-demand, and are discarded when no longer needed. This technique enables users to visualize a virtually unlimited amount of spatial data on a map, though these solutions are rare in the market today. WMS imagery can also be stacked in several ordered layers to produce multi-layered maps. When powered by a high-performance server-side technology, WMS is one of the most scalable data visualization options for spatial data today.
Rendering Styles
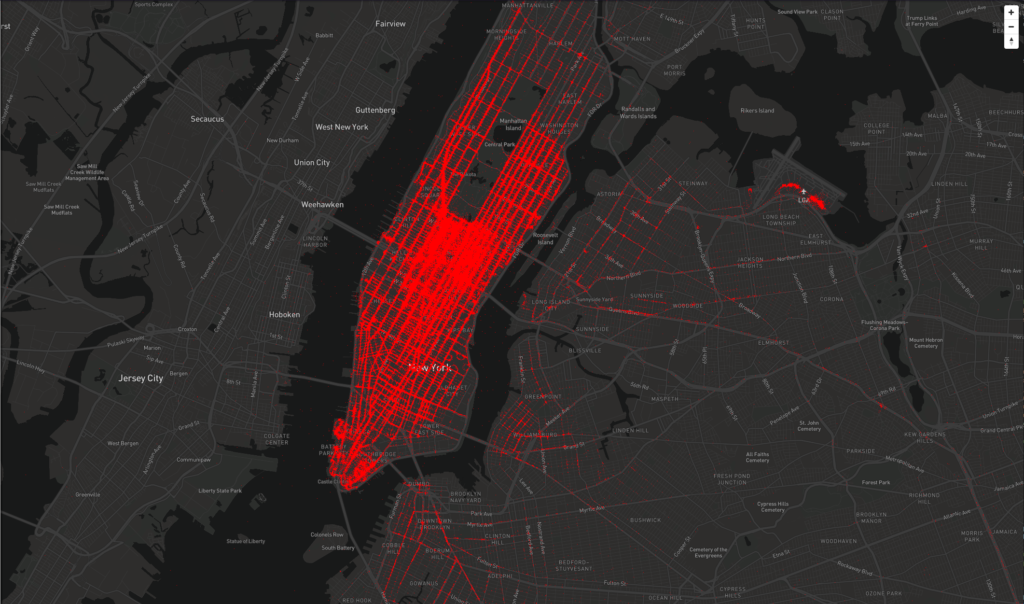
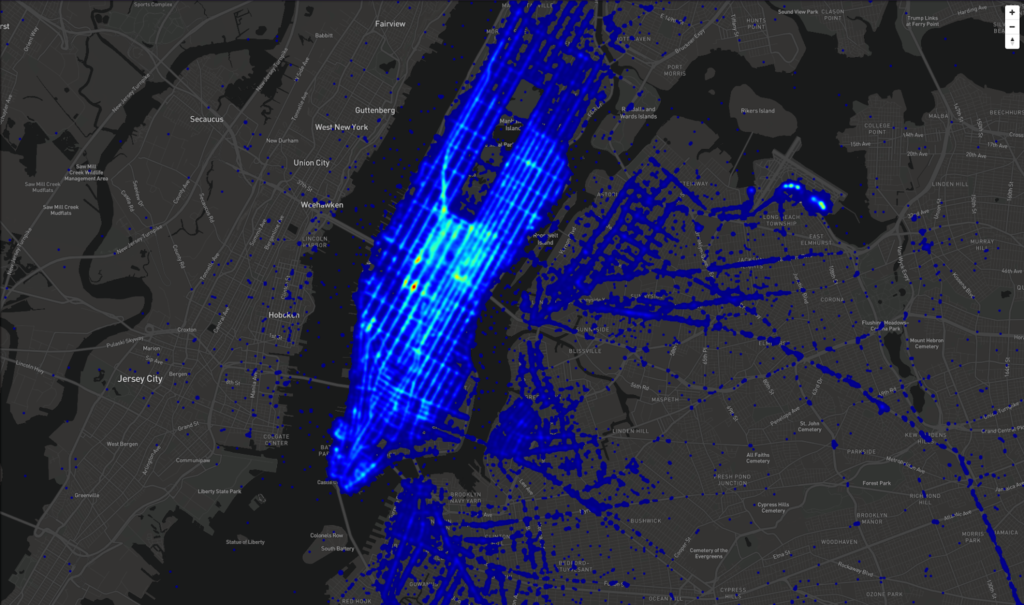
When visualizing spatial objects, it is important to select the proper rendering style to communicate the data as clearly as possible. The simplest spatial visualization colors each feature in a single color. Features can also be colored differently, according to their attributes. For example, GPS transponders moving faster than 50 mph could be considered to be driving dangerously, so they are colored red, while ones moving slower are green. For extremely dense spatial data, it may be more beneficial to view features as a heatmap, where a color ramp is used to communicate the sparseness or denseness of features on a map. When displaying continuous data, like elevation, contour plots are the preferred way to understand where elevation changes occur. Related to contour plots, Isochrones and Isodistance lines can show the boundaries of travel time or distance traveled on a road network to visualize accurate travel distances on a map.
Real-Time Spatial Analysis
Due to the proliferation of IoT devices, the volume of spatial data continues to grow at an unprecedented rate. This data is often perishable, and must be processed and analyzed quickly after it is captured. Due to the large volume of data, real-time spatial analysis is a difficult workload to complete in a timely manner, requiring a distributed processing architecture. Distributed processing frameworks like these are nascent and often difficult to administer. They may also lack the deep spatial functionality that legacy systems once offered. As a result, there are few turnkey solutions on the market today that deliver real-time spatial analysis.
