Introduction
Most analytics platforms struggle to support the full range of operations required for complex real-world problems. Spatial, graph, time series, and vector search capabilities are often siloed into separate tools, forcing users to stitch together workflows across multiple systems—creating inefficiencies, bottlenecks, and integration challenges. Kinetica eliminates this friction by unifying these advanced analytics within a relational framework. Users can perform deep analytical operations—such as computing isochrones, solving shortest paths, and aggregating spatial zones—within a single SQL query, streamlining decision-making that would otherwise demand multiple systems and custom engineering. This blog demonstrates how Kinetica’s built-in capabilities enable high-speed reachability and coverage analysis with remarkable efficiency.

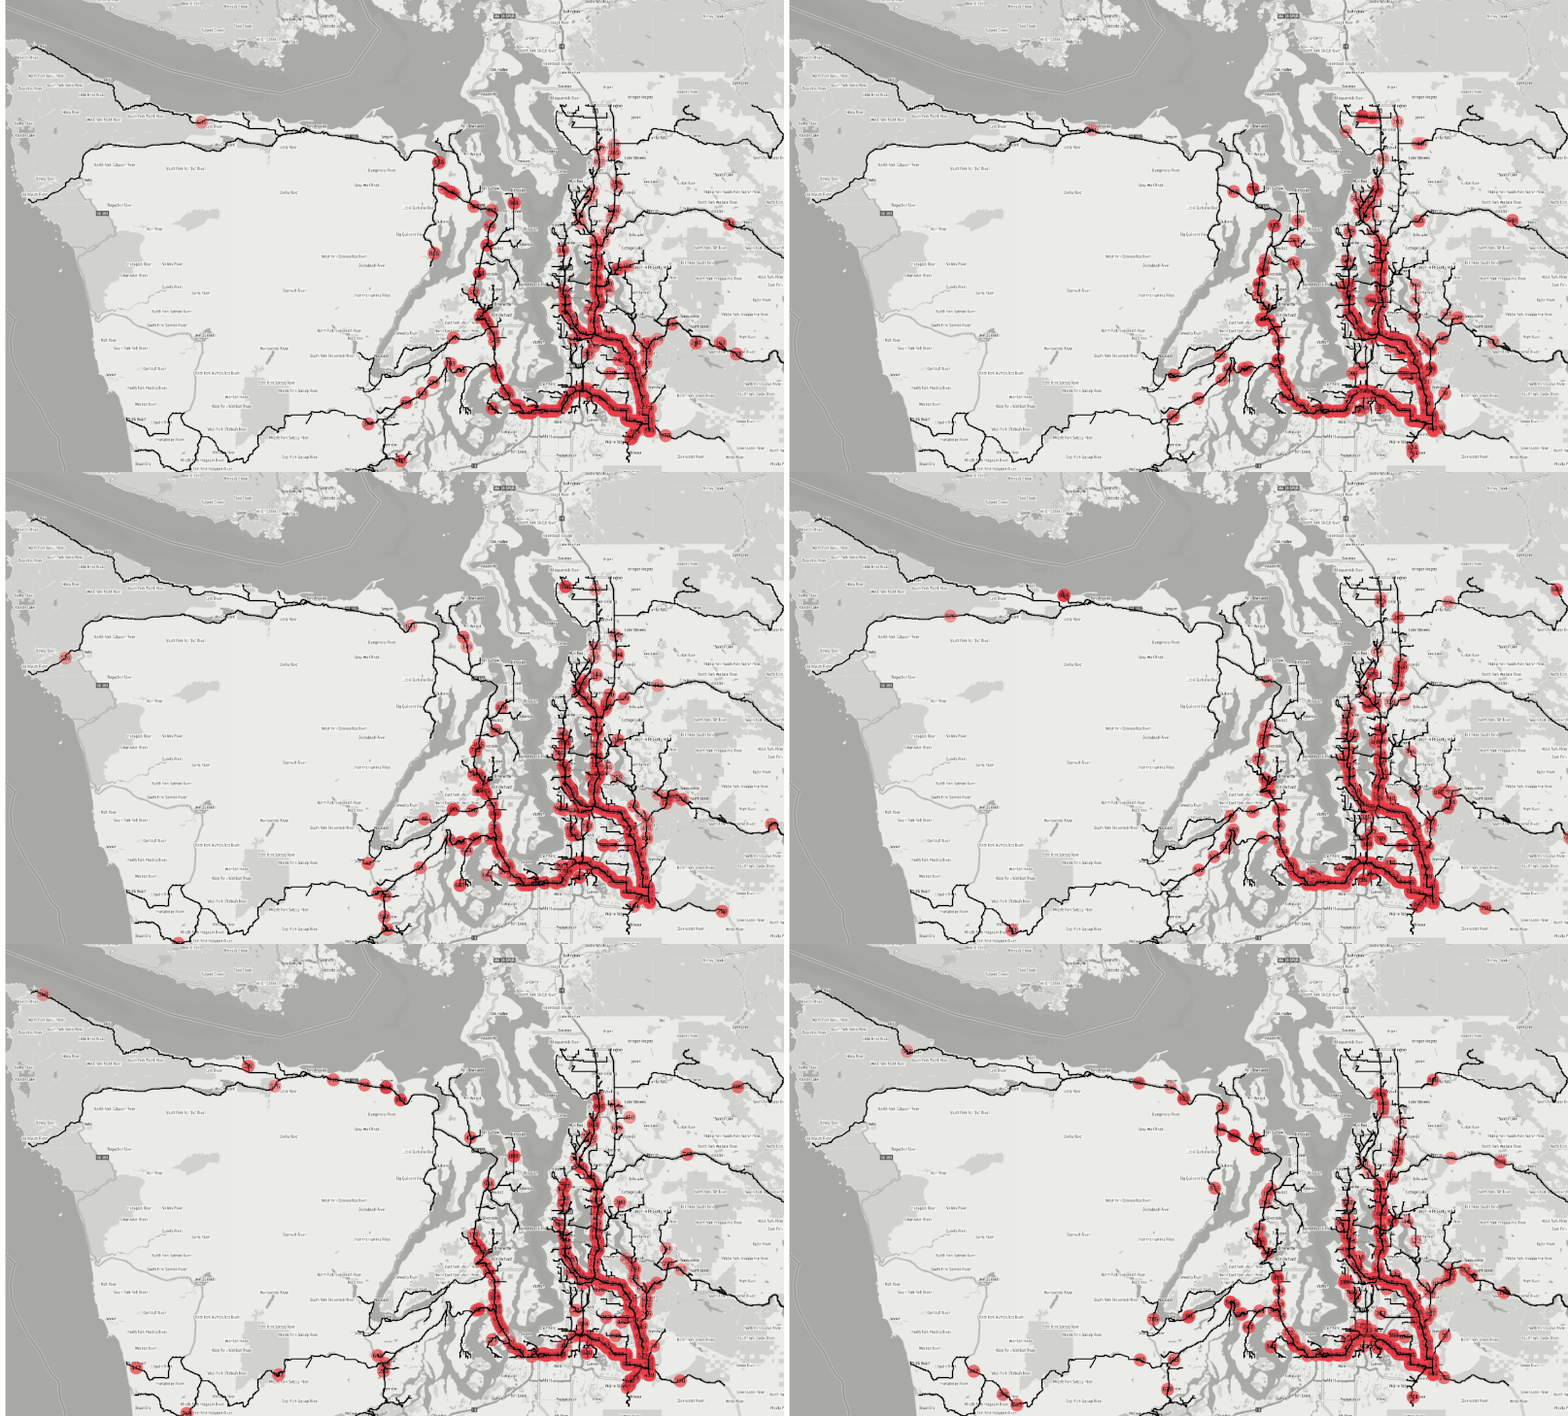
Figure 1 : The animation is created from the agglomerated isochrones from 500+ fire stations in the Seattle area within 1,2,3,4,5 and 10 minutes successively by applying the SQL statement shown in Figure 3.

How long does it take for a fire truck to reach a certain location from all available stations is an important question for many interested parties; for the home owner to protect his/her house, for the city officials to ascertain disaster reflex capabilities, for the insurance industry to set premiums on a sensible criterion, etc. Similar questions can also arise for individual businesses so that new franchise locations could optimally be chosen that would make sense for customer coverage and improve overall competitiveness.
Understanding Isochrones and Reachability Zones
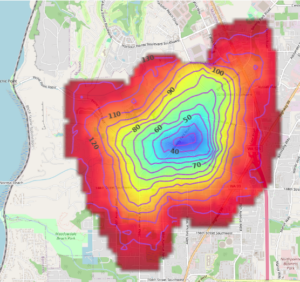
In the case of fire stations, the reachability zone from each station within some fixed time limit is calculable with the road network topology (graph) and traffic conditions (graph weights). These reachability zones are often depicted on the road network as polygons or closed contours, which are simple isolines of travel times and more specifically called as isochrones (see left figure). The locations reachable within 120 secs from a fire station could also be reached by another fire station in the proximity, possibly in less than two minutes. Hence, the overlap zone of isochrones among the available fire stations can be unioned to discern the coverage area by all fire stations. This would require computing isochrones from all stations – potentially tens of thousands, say, for the continental United States. Each isochrone solve is essentially a Dijkstra algorithm that would stop propagating up-to the chosen time threshold of 1,2,..10 minutes, etc. It is worth noting that the reachability is calculated using the road network, not geodesic distance. Therefore, the success of this particular use case depends on the scalability aspect of the solution.
Kinetica’s Scalable Approach to Isochrone Computation
Kinetica has implemented an all-in-house distributed graph (geo and social) database that works in tandem with the distributed relational (OLAP) database [1-5]. A multi-threaded batch version of the isochrone solver where polygons are generated from the concave hulling of the network locations within the isochrone time limit is specifically implemented with the scalability requirement in mind. Kinetica has graph and OLAP as one product so that users would not need to patch libraries/tools, but in one simple SQL statement, this computationally intensive use case could be run very efficiently.


Figure 2: Isochrone coverages from 500+ fire stations around the Seattle metro area in 1,2,3,4 minute intervals.
Performance and Efficiency of Kinetica’s Solution
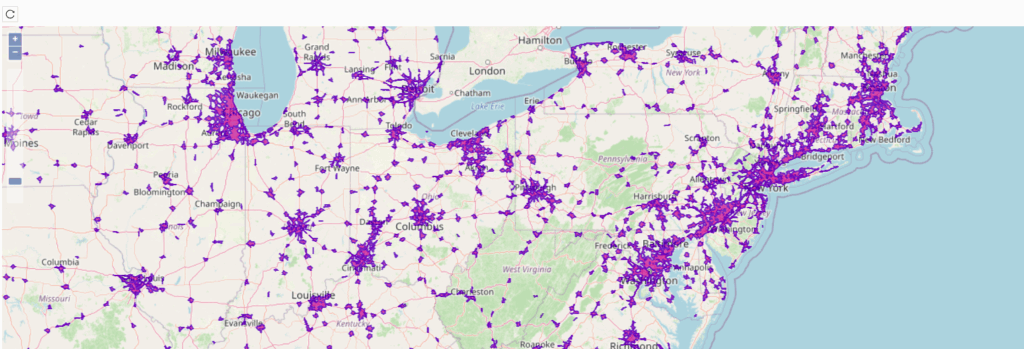
The area isochrone computation for the ‘Fire Stations’ in the SQL statement shown in Figure 3 takes less than two seconds on our production cluster for 500+ fire stations found among 104 million places FSQ dataset within the Seattle metro area WKT polygon. The SQL statement can easily be modified by two simple changes; one for the isochrone value, depicted below as 120 seconds, and the other one is the search string for the place’s name – For instance, searching for Starbucks coverage, it is just enough to change the search line in the SQL statement to ‘name LIKE ‘%Starbucks%’’ – Figure 4 below shows the result of the Starbucks isochrones in 5km range across the entire US road network. Almost 55k entries are run in the isochrone computation in batch mode and the resulting polygons are agglomerated and unioned – all less than 30 secs on our 8 node cluster. One other important caveat of running the shortest path solver for businesses is that instead of the direction of the solve going off of the business centers, we need to consider all other locations in the graph going towards the businesses. Hence, the solver is modified to be an ‘INVERSE_SHORTEST_PATH’ solver where during the solve, the directionality of the graph edges are temporarily inverted (the idea of this solver is a trademark algorithm under Kinetica-Graph analytics suite).
-- Finding 4 min aggregated coverage for fire stations in Seattle metro
SELECT ST_DISSOLVEOVERLAPPING(poly) as WKT
 FROM
 (SELECT ST_CONCAVEHULL(ST_COLLECT_AGGREGATE(ST_MAKEPOINT(x,y)),0.8) AS poly
    FROM
    SOLVE_GRAPH
    (GRAPH => 'public.osm_seattle_metro_road_network',
      SOLVER_TYPE => 'SHORTEST_PATH',
      SOURCE_NODES => INPUT_TABLES(
           (SELECT geom AS WKTPOINT from public.fsq_places
            WHERE
                  STXY_INTERSECTS(longitude,latitude,
                   'POLYGON ((-124.7228 47.03614, -121.16819 47.03614, -121.16819 48.578765, -124.72282 48.57876, -124.72282 47.03614))')
                AND
                  STRING(fsq_category_labels) LIKE '%Fire Station%'
           )
      ),
      OPTIONS => KV_PAIRS(max_solution_radius = '240')
    )
    WHERE z < 240
    GROUP by SOURCE)
Figure 3: Unioned Isochrone polygon computation and aggregations all in one SQL statement from FSQ places public data for all fire stations in Seattle within 120 seconds.


Figure 4: Starbucks isochrones in 5km across the US more than 52.7k – (right) Isochrones zoomed in around the northeast. This is computed in less than 30 secs including finding Starbucks locations, computing, aggregating for forming individual polygons and unioning (dissolve overlap) as shown in one line SQL in Figure 3.
Competitive Insights for Business Decisions
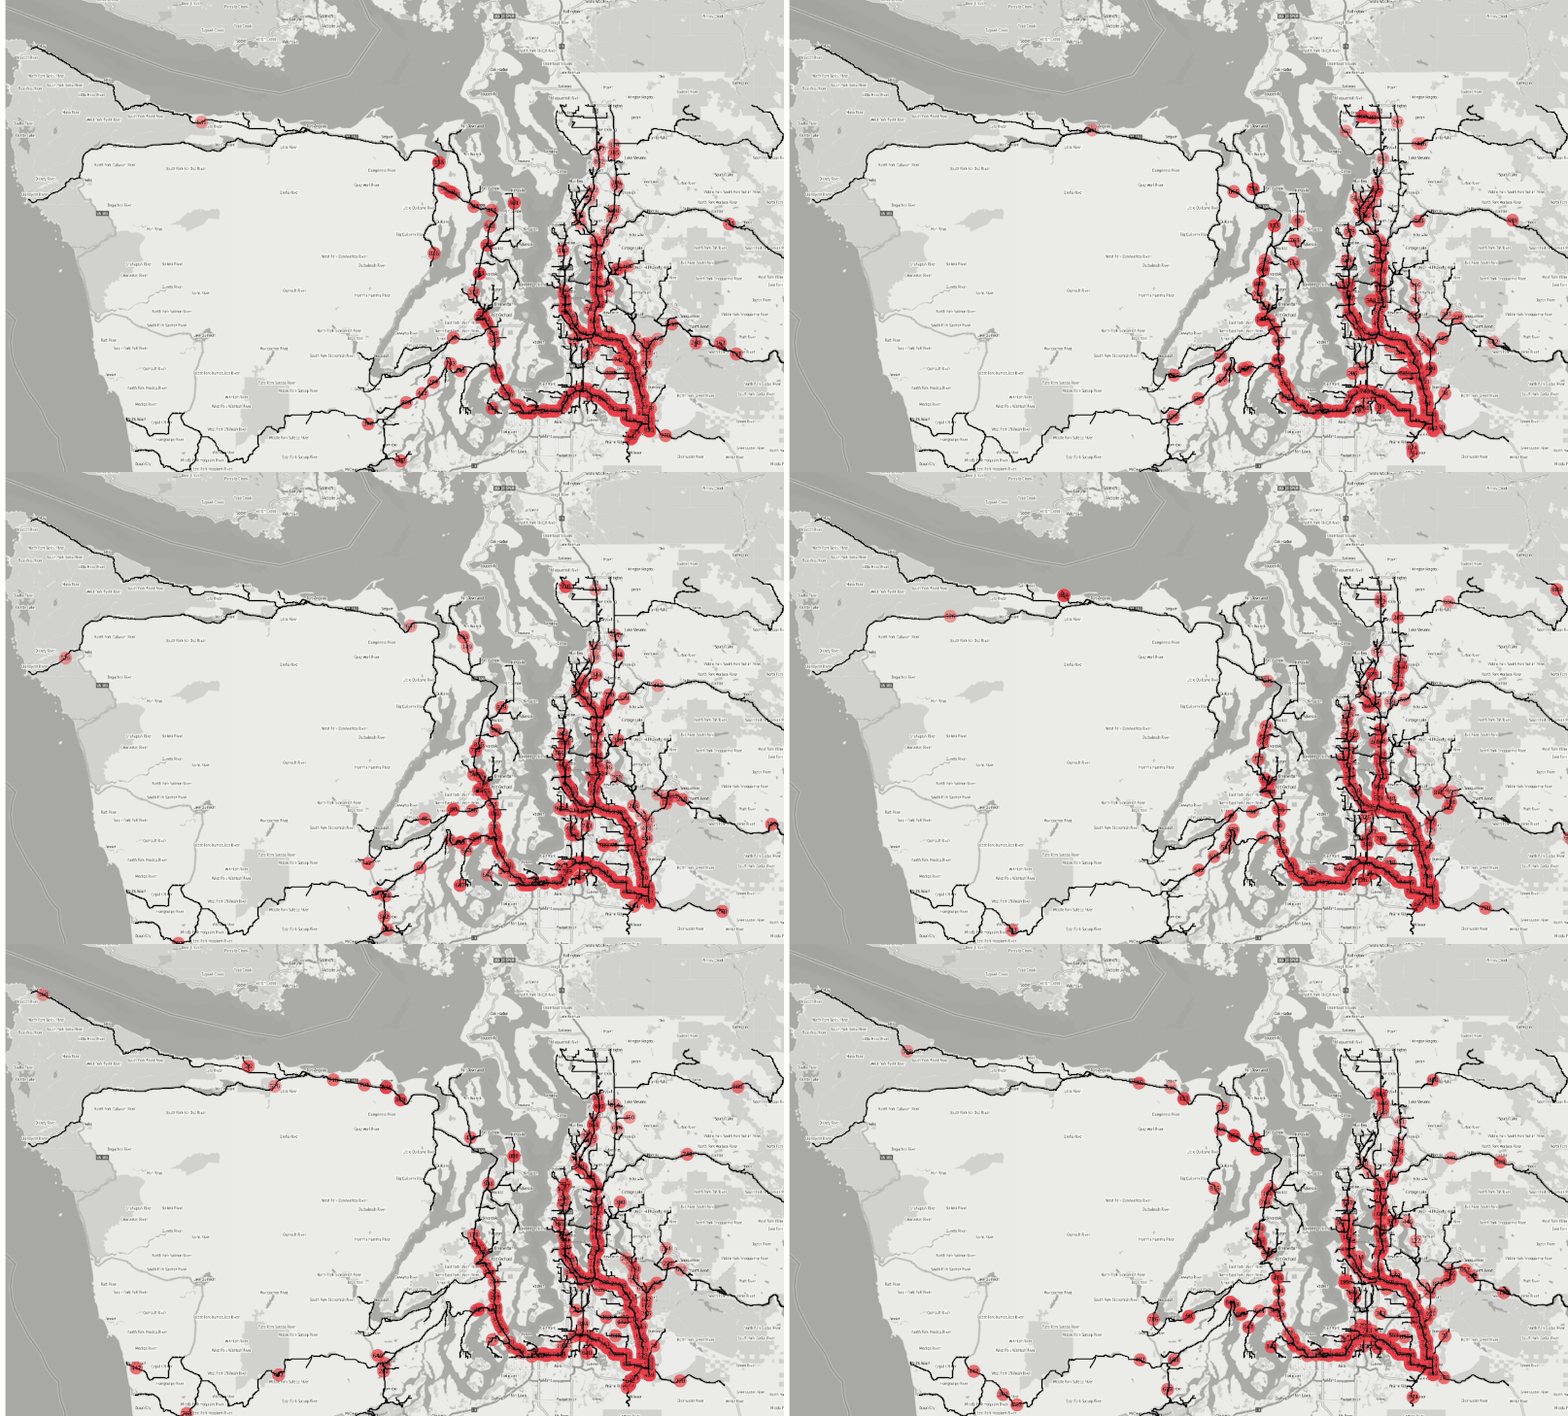
Finally, if we run the SQL statement in Figure 3, searching for 2 minute isochrone coverages for ‘Starbucks’, ‘Peets’ and ‘7-Eleven’ cafes separately, and superimpose the results to have an idea of where the overlaps are occurring as shown in Figure 5 that would give a great insight for business decisions among competitive vendors.

Figure 5: Competitive 2-minute isochrone coverages for various Cafe businesses in Seattle metro.
Lastly, The simulation of a central location being served from 500+ fire stations is demonstrated by the use of the inverse shortest path batch solves in the following Kinetica-Graph SQL query below:
-- Find the fastest fire stations to reach to a disaster x,y location among all available over seattle road network
-- Click on
DROP TABLE IF EXISTS batch_sssp;
EXECUTE FUNCTION
MATCH_GRAPH(
GRAPH => 'public.osm_seattle_metro_road_network',
SAMPLE_POINTS => INPUT_TABLES(
   (SELECT ROW_NUMBER() OVER (PARTITION BY NULL ORDER BY fsq_place_id) AS OD_ID,
           ST_GEOMFROMTEXT('POINT(-121.958755 47.177694)') AS ORIGIN_WKTPOINT,
           geom AS DESTINATION_WKTPOINT
    FROM public.fsq_places
        WHERE  STXY_INTERSECTS(longitude,latitude,'POLYGON ((-124.7228 47.03614, -121.16819 47.03614, -121.16819 48.578765, -124.72282 48.57876, -124.72282 47.03614))') AND
        STRING(fsq_category_labels) LIKE '%Fire Station%')
   ),
SOLVE_METHOD => 'match_batch_solves',
SOLUTION_TABLE => 'batch_sssp',
OPTIONS => KV_PAIRS(inverse_solve = 'true', output_tracks = 'true', svg_speed = '50', svg_basemap = 'true'));
Figure 6: Simulation of finding the fastest fire stations to reach a disaster location among all available.
Animation is an SVG file in the response field of the Restful Graph solver api whose speed can also be adjusted via the option ‘svg_speed’ as seen in Figure 7 below:

Figure 7: SVG animation of the batch solve simulation for fire emergencies.
This Would Be Impossible with Any Other Single Solution
Kinetica unifies spatial, graph, and time-series analytics within a single SQL query, making complex reachability and coverage analysis both possible and highly efficient. Computing isochrones to assess coverage typically requires multiple tools and extensive data engineering, but with Kinetica’s speed and simplicity, it can be executed seamlessly using just a tiny SQL query.
Try It Out
The entire SQL workbook with its data required to replicate the above use case is available on our free SaaS instance as a featured example and in kinetica’s example repo.
References
- B. Kaan Karamete, Louai Adhami, Eli Glaser, ‘A fixed storage distributed graph database hybrid with at-scale OLAP expression and I/O support of a relational DB: Kinetica-Graph’, https://arxiv.org/abs/2201.02136 [CS.DB], 20 pages – Jan 6, 2022.
- B. Kaan Karamete, Eli Glaser, ‘An Ad-hoc graph node vector embedding algorithm for general knowledge graphs using Kinetica-Graph’, https://arxiv.org/abs/2407.15906 [CS.LG, CS.AI] July 23, 2024
- B. Kaan Karamete, Eli Glaser, ‘Novel data structures for label based queries specifically efficient for billion+ property graph networks using Kinetica-Graph’, https://arxiv.org/abs/2311.03631 [CS.DS], 11 pages – Nov 7, 2023
- B. Kaan Karamete, Eli Glaser, ‘Optimal routing algorithm for trips involving thousands of ev-charging stations using Kinetica-Graph’, https://arxiv.org/abs/2206.06241 [CS.DC, MATH.OC], 13 pages – May 19, 2022.
- Karamete, BK., Adhami, L., Glaser, E., ‘An adaptive Markov Chain Algorithm applied over map matching of vehicle trip GPS data’, Journal of Geospatial Information Science. 24(3): 484-497 (2021), Taylor & Francis. https://www.tandfonline.com/doi/epdf/10.1080/10095020.2020.1866956?
