Interactive Geospatial Analysis with Massive Datasets
As more and more data becomes available from sensors, from customers, from transactions—much of it with time and location information—there are increasing demands to analyze these data sets and visualize the results on maps.
But today’s geospatial toolsets are hardly up to the task. Spatial databases weren’t designed for a world where IoT systems might be tracking millions of sensors generating frequent updates. If you want to do analysis on large datasets with any sort of interactivity, if you want to visualize millions or billions of records—and then filter them and see results based on different groupings—then you’re going to need to solve a couple fundamental challenges:
The first challenge is that most databases are simply not designed to perform large-scale geospatial analytics in a reasonable amount of time. Imagine trying to analyze millions of customer purchases and aggregating those based on ad-hoc proximity to retail stores. The types of polygon intersection calculations needed to run this are expensive. Multiply that by millions or billions of records, and your query may leave you waiting all week. Not a problem if you only need to do it once, but if you want to give business users the ability to make ad-hoc queries on data, this is not acceptable.
The second challenge is how to visualize large geospatial datasets with any sort of interactivity. Web browsers struggle to handle more than a few thousand features, and it takes time to send large volumes of data over the wire. Send more than several thousand points or a thousand polygons to a browser and you will see your browser slow to a crawl. Eventually there is a threshold where it’s not practical to send all your data across the wire for the client to sort out.
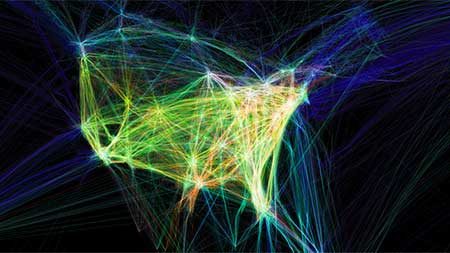
Rendering of US flight tracks with geospatial mapping. It may take hours or days for traditional mapping tools to develop images with this density of information. | 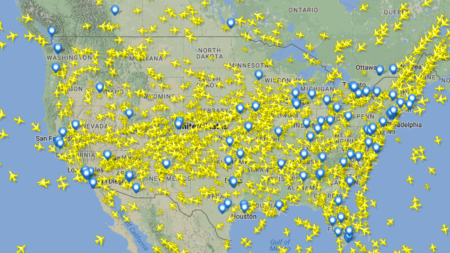
Interactive web-based flight from Flightradar24…. at the limits of what can be rendered interactively on the web. Source: http://www.flightradar24.com/ |
Leveraging GPUs for Ultra-Fast Spatial Computation
So how do you solve for the performance challenges of more complex analytics with large geospatial datasets?
The founders of Kinetica faced this challenge when working with the US Intelligence Community to tackle real-time mapping of security threats. Existing database options weren’t designed to handle streaming data with spatial and time series attributes, and they were unable to provide the geospatial capabilities or performance for this type of data to be useful in real time.
GPUs presented an opportunity to solve the computational challenge. Graphics Processing Units (GPUs) were originally designed to speed up video games, but their parallelized processing capabilities are also ideal for the types of types of vector and matrix calculations needed for geospatial analysis.
Almost any database can be used to store geospatial data: coordinates can be stored as floats, and shapes can be converted into a WKT format and stored in a text column. But while the database can store data this way, it isn’t readily available for query. A separate geospatial system would need to retrieve these records, convert them into a geometry objects, and evaluate the match—one record at a time.
What is needed is a spatially-aware database that has a geometry engine built in. A database that can work natively with geospatial data and compute relationships between shapes and objects within a single system. Kinetica was built with such spatial capabilities built in:
Native Geospatial Objects:
Native support for geospatial objects such as points, lines, polygons, tracks, and labels, and storing and interpreting these objects as OGC-compliant WKT, makes it easy to ingest from, or export to, other systems.
Native Spatial Operators:
A suite of geospatial functions that run natively within the database makes it possible to get fast results on queries such as the following :
Spatial Queries Find all households within 10mi of a store
|
Spatial Joins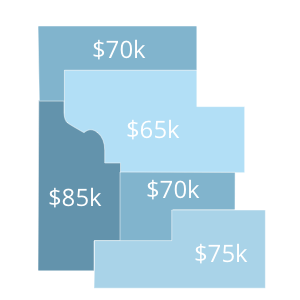 Calculate average income per zipcode
|
Advanced Spatial Analytics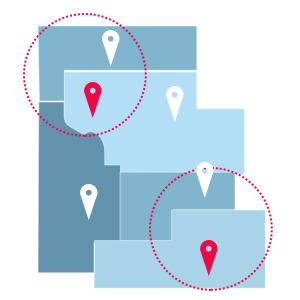 Identify retail locations where over 50% of households earn more than $50k, and where there are over 5,000 households within within 10mi of a store.
|
Geospatial queries are frequently compute intensive. As the volume of data increases, performance becomes an ever more critical issue. Kinetica has been designed to harness the power of the GPU for exceptionally fast query response, even across the largest datasets. Spreading spatial computations across thousands of GPU nodes, across multiple cards, and multiple machines is an exceptional solution for the types of brute-force calculations needed for advanced analysis of large and streaming geospatial-temporal datasets.
And with the rise of IoT data – such as social media feeds, moving vehicles and sensors – a modern geospatial database must also be able to handle high velocity streaming data. Multi-head ingest design enables each node within a cluster to share the work of absorbing streaming data. And since the GPU offers such tremendous performance improvements on query, less indexing is required and data can be made available to query the moment it arrives. This opens up tremendous new opportunities for real-time and predictive analytics.
A Geospatial Visualization Pipeline for Large Datasets
So, the challenge of real-time geospatial analytics at scale can be met with a GPU-accelerated spatial database, but that still leaves the challenge of how to visualize large datasets with any sort of interactivity. Remember, if you’re outputting more than a few thousand points or polygons across a wire to a mapping client, things are liable to grind to a crawl.
Kinetica addresses this with a native visualization pipeline capable of leveraging the GPU to quickly render vector-based map visualizations, on-the-fly.
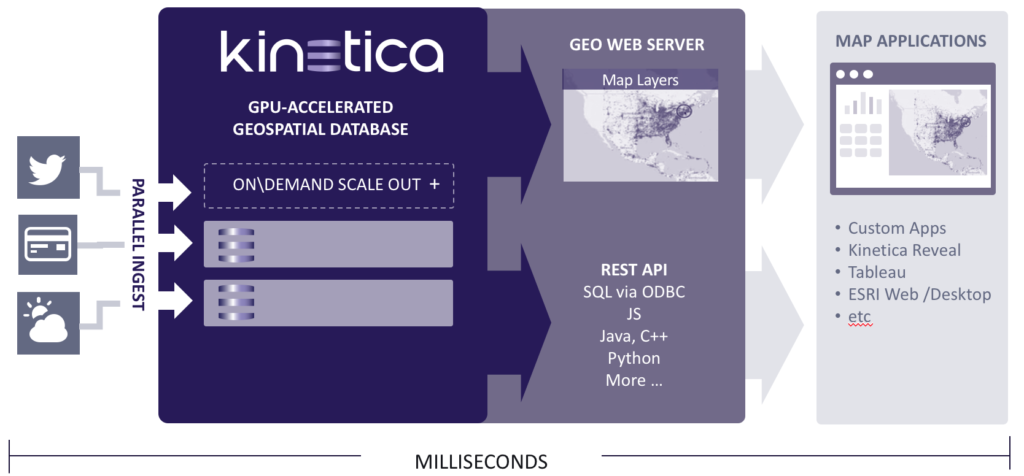
The Kinetica Visualization API also comes with the tools necessary to interact with those maps, drill into, and explore individual points and shapes on that map. These can be overlaid on top of base-maps from ESRI, Google, Bing, Mapbox etc.
 4bn Twitter Posts Rendered on a map in sub-second time. No Indexes, No caching.
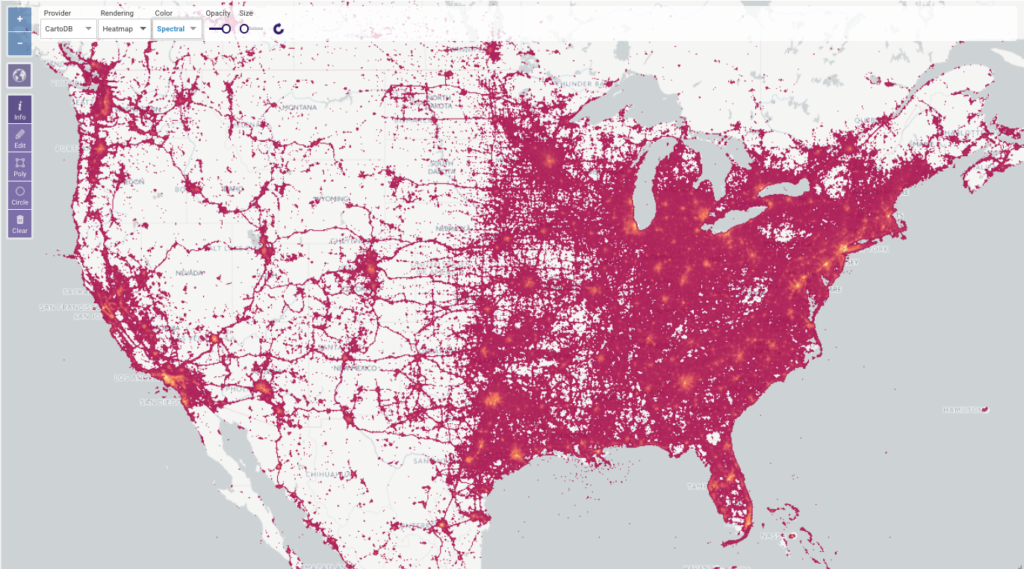
Advanced Visualization Options
The visualization layer also includes some more advanced functionality, including heat-maps and color-coded filtering. These dynamic map visualizations can be integrated with any OGC-compliant web mapping API to allow for interaction with features. The below visualization of querying a large twitter dataset illustrates some of these capabilities:
Advanced Analytics and Machine Learning with Geospatial Data
Geospatial analysis can be further extended through the User-Defined Functions API – an interface that makes it possible for custom code to run from within the database. Through UDFs, almost any type of analysis is possible. Even for highly customized geospatial operations, the dataset does not need to be extracted into a separate system for analysis. Instead, models can be brought to the data, to be run ‘in-database.’
This opens a world of possibilities—custom code can even call out to machine learning libraries, such as TensorFlow, for advanced geospatial predictions. This might make it possible for deliveries to be flagged when they are unlikely to arrive on time—based on traffic, weather, or other indicators. Insurance companies could better analyze drivers that are most likely to be involved in an accident based on driving behavior; or they could calculate risk for assets from weather models.
What Can You Build with This?
The combination of real-time streaming query, native geospatial operators, and advanced map-based visualizations opens opportunities for businesses to perform analyses that were previously difficult or impossible.
Any company with large volumes of geo-temporal data will have their own demands and opportunities from that data. Customers are using Kinetica for mapping infrastructure, for logistics, for customer research, and more.
Find out more about how to location based analytics with Kinetica with a discussion with one of our solutions engineers. Book a Demo
Making Sense of Sensor Data