Introduction: The Limits of Embeddings and Graphs in Isolation
Graph databases are powerful tools for modeling relationships, but the connections between the nodes do not necessarily follow a semantic intuition, or language rules (LLM). Meanwhile, embedding models – that transform general knowledge graphs into vector embeddings using algorithms like word2vec or our recently published concept[1] which computes and flattens many graph predicates over vector spaces–fail to accurately capture both local and remote affinities represented by infinite-dimension graphs as limited-dimension vectors. The main reason is that the relations are mere ad-hoc connections that do not necessarily follow a pattern — however, the best pattern for query accuracy is the graph itself. Hence, the reverse process, i.e., injecting vector similarities as connections to the graph where its schema (ontology) is purpose built further improves graph’s abilities with far reaching potentials – hops away relations are by definition much more reliably accurate as they are rectified by connections from nodes that are proven to be similar.
What if you could combine the best of both worlds?
This blog explores how embedding vector similarity directly into a knowledge graph can supercharge your reasoning capabilities. We show how to enrich a demographic graph with similarity-based connections (derived from movie preferences), allowing more accurate, far-reaching inferences—without blowing up your query complexity.
Here’s how we started: A graph built on demographic edges, now enriched with similarity-based edges between individuals whose movie tastes align above a threshold.
-- Create a table for graph attributes
CREATE OR REPLACE TABLE relations(name text, birth text, company text, school text, movie_likes vector(6));

-- Graph attributes along with movie preferences [horror,romantic,action,suspense,comedy,scifi]
INSERT INTO relations VALUES('kaan','turkey','kinetica','rpi','[0.7,0.0,0.5,0.8,0.3,1.0]');
INSERT INTO relations VALUES('tan', 'usa','ft','uva','[0.7,0.2,0.8,0.8,0.5,1.0]');
INSERT INTO relations VALUES('jony','usa','kinetica','penn','[0.3,0.2,0.5,0.6,0.4,0.8]');
INSERT INTO relations VALUES('samy','usa','kinetica','jh','[0.1,1.0,0.3,0.3,0.8,0.4]');
INSERT INTO relations VALUES('rony','india', 'kinetica', 'gm','[0.4,0.6,0.2,0.4,0.7,0.2]');
INSERT INTO relations VALUES('beny','india','simmetrix','rpi','[0.0,0.9,0.1,0.6,0.9,0.5]');
INSERT INTO relations VALUES('jimy','usa','apple','uva','[0.0,0.9,0.1,0.6,0.9,0.5]');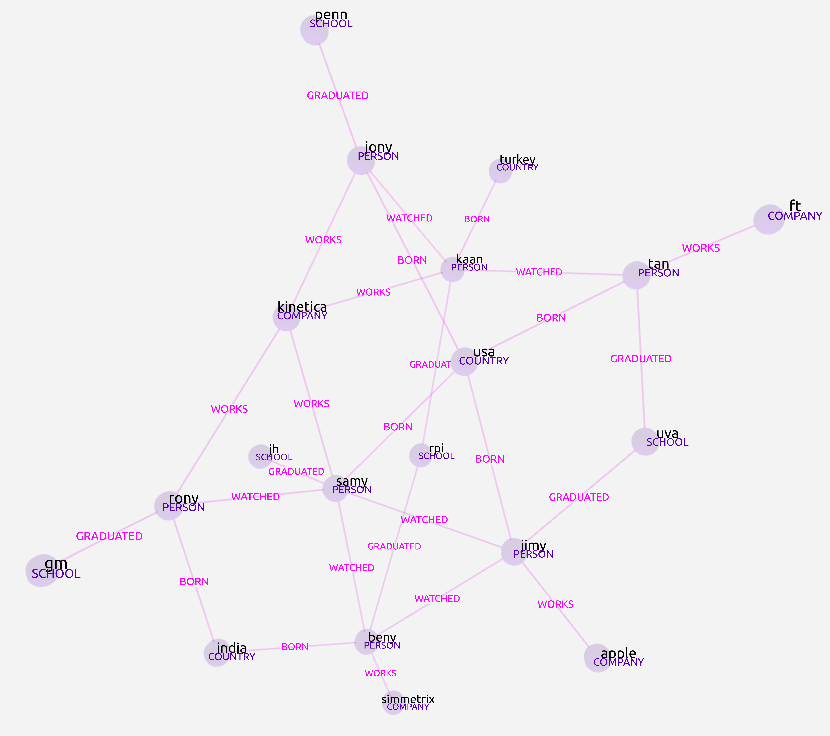
-- Create a directed graph
CREATE OR REPLACE DIRECTED GRAPH netflix
(
   NODES => INPUT_TABLES(
       (SELECT name    AS NODE, 'PERSON'  AS LABEL FROM relations),
       (SELECT birth   AS NODE, 'COUNTRY' AS LABEL FROM relations),
       (SELECT company AS NODE, 'COMPANY' AS LABEL FROM relations),
       (SELECT school  AS NODE, 'SCHOOL'  AS LABEL FROM relations)
   ),
   EDGES => INPUT_TABLES(
       (SELECT name AS NODE1, birth   AS NODE2,  'BORN'      AS LABEL, float(1.0) AS WEIGHT_VALUESPECIFIED FROM relations),
       (SELECT name AS NODE1, company AS NODE2,  'WORKS'     AS LABEL, float(1.0) AS WEIGHT_VALUESPECIFIED FROM relations),
       (SELECT name AS NODE1, school  AS NODE2,  'GRADUATED' AS LABEL, float(1.0) AS WEIGHT_VALUESPECIFIED FROM relations),
       (
          SELECT
             t1.name AS NODE1, t2.name AS NODE2, 'WATCHED'  AS LABEL,
             l2_distance(t1.movie_likes,t2.movie_likes)     AS WEIGHT_VALUESPECIFIED
          FROM  relations as t1
          CROSS JOIN relations AS t2
          WHERE l2_distance(t1.movie_likes,t2.movie_likes) < 4*float(1.0/7.0) and STRCMP(t1.name, t2.name) = -1
       )
   ),
   OPTIONS => KV_PAIRS( graph_table = 'netflix_graph')
);
To demonstrate this concept, we created a simple example using Kinetica-Graph [1-5], an all in-house developed distributed, dynamic and hybrid database engine where individuals have their rich set of demographics modelled as a directed graph (See Figure 1,2).
For instance, a movie streaming company might be interested in finding demographic similarities among the individuals whose movie likes are similar based on a list of choice probabilities in movie-genres of horror, romantic, action, suspense, comedy and scifi depicted as vector embeddings. In essence, the data modelled as a graph is further enriched by the connections based on the movie-choice similarities of pairs of individuals. This vector-informed enrichment doesn’t just add more edges—it enables new types of questions that would be hard or inefficient to answer otherwise.
A noteworthy point here is that the graph alone from the demographics cannot find the difference between people who have attended the same university as not everyone in the group would resemble the same desires for their movie choices. Though, the argument could also be made from an OLAP point of view to post-filter the set of individuals having found everyone who attended the same school. This might have worked if we did not add yet another feature, say the people whose current employers are similar. After all, it is always possible to find the answer by employing many joins/filters but with such effort among different models OLAP/GRAPH/VECTOR and thus with such inefficiency, not to mention the computationally formidable aspect of recursive joins for billion+ edge graphs.
In many traditional pipelines, analysts juggle OLAP queries, recursive joins, and brittle workflows. But by combining vector similarity, graph semantics, and relational operations into a single engine, we can simplify the model and query patterns drastically. Instead of many individual models with complex queries, a much better answer is rectifying data relations as one graph model with combined strengths from OLAP/GRAPH/VECTOR and using simple queries to reach the same answer more easily, efficiently and cleanly.
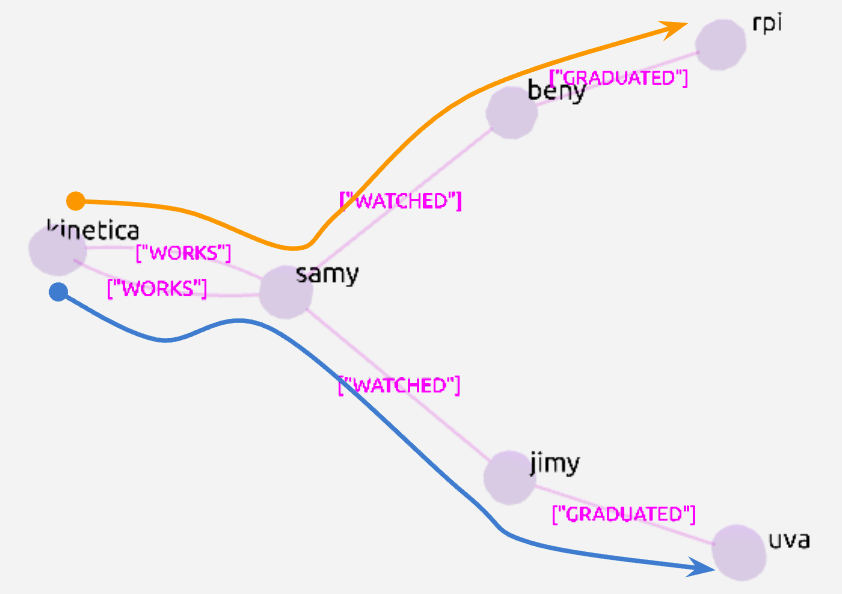
Let’s walk through a real-world example. Suppose we want to identify the graduating schools of individuals who have similar movie preferences to Kinetica employees (within three hops). Using a multi-hop graph query, this becomes a single, elegant operation.
--Multi-hop pattern graph query to find the graduating schools for individuals whose movie choices are similar to the employees of our company Kinetica. Corresponding cypher query is also depicted below.
-- MATCH (a:COMPANY { company :'kinetica') <- [:WORKS] <- (:PERSON) <- [:WATCHED] <- (:PERSON) -> [:GRADUATED] -> (d:SCHOOL)
DROP TABLE IF EXISTS netflix_query;
EXECUTE FUNCTION
   QUERY_GRAPH(
     GRAPH => 'netflix',
     QUERIES => INPUT_TABLES(
       (SELECT 'kinetica' AS NODE),
       (SELECT -1 AS HOP_ID, 'PERSON'    AS NODE_LABEL),
       (SELECT -1 AS HOP_ID, 'WORKS'     AS EDGE_LABEL),
       (SELECT -2 AS HOP_ID, 'WATCHED'   AS EDGE_LABEL),
       (SELECT -2 AS HOP_ID, 'PERSON'    AS NODE_LABEL),
       (SELECT 3  AS HOP_ID, 'GRADUATED' AS EDGE_LABEL),
       (SELECT 3  AS HOP_ID, 'SCHOOL'    AS NODE_LABEL)
     ),
     RINGS => 3,
     ADJACENCY_TABLE => 'netflix_query',
     OPTIONS => KV_PAIRS(use_cypher = 'true')
   );
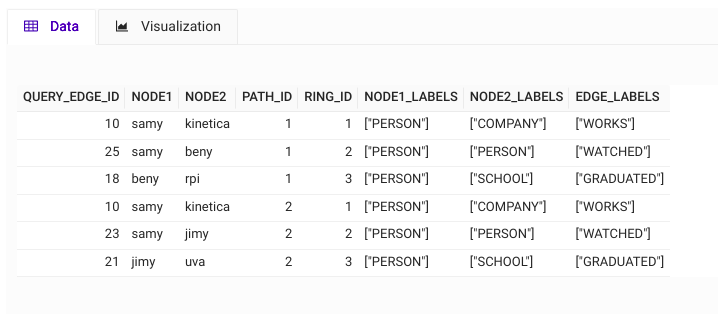
Employee ‘samy’ seems to be friends to two individuals ‘beny’ and ‘jimy’ whose movie choices are very similar to ‘samy’ and they are the graduates of ‘uva’ and ‘rpi’, thanks to the multi-hop graph query result as shown in Figure 4 where two paths exist with PATH_ID/RING_ID columns.
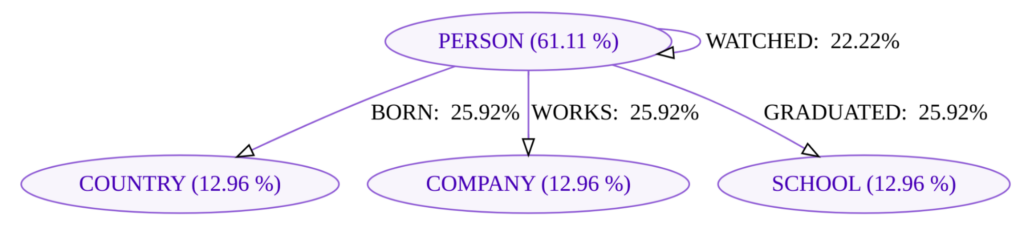
Note that many more criteria can also be embedded at each hop level – our graph query has embedded OLAP expression support that allows any OLAP operation as joins/groupby’s and more as long as the resulting columns are annotated with the appropriate graph grammar, such as the HOP_ID, NODE_LABEL two-tuple as shown in Figure 3.
Kinetica unifies spatial, graph, and time-series analytics within a single SQL query, making complex queries both possible and highly efficient. This hybrid approach—fusing vector similarity, graph semantics, and OLAP expressions—opens up new avenues for reasoning that neither embeddings nor traditional graphs can handle alone. It’s not just smarter queries—it’s a smarter model. The entire SQL workbook with its data required to replicate the above use case is available on our examples repo.
References
- B. Kaan Karamete, Eli Glaser, ‘An Ad-hoc graph node vector embedding algorithm for general knowledge graphs using Kinetica-Graph’, https://arxiv.org/abs/2407.15906 [CS.LG, CS.AI] July 23, 2024
- B. Kaan Karamete, Louai Adhami, Eli Glaser, ‘A fixed storage distributed graph database hybrid with at-scale OLAP expression and I/O support of a relational DB: Kinetica-Graph’, https://arxiv.org/abs/2201.02136 [CS.DB], 20 pages – Jan 6, 2022.
- B. Kaan Karamete, Eli Glaser, ‘Novel data structures for label based queries specifically efficient for billion+ property graph networks using Kinetica-Graph’, https://arxiv.org/abs/2311.03631 [CS.DS], 11 pages – Nov 7, 2023
- B. Kaan Karamete, Eli Glaser, ‘Optimal routing algorithm for trips involving thousands of ev-charging stations using Kinetica-Graph’, https://arxiv.org/abs/2206.06241 [CS.DC, MATH.OC], 13 pages – May 19, 2022.
- Karamete, BK., Adhami, L., Glaser, E., ‘An adaptive Markov Chain Algorithm applied over map matching of vehicle trip GPS data’, Journal of Geospatial Information Science. 24(3): 484-497 (2021), Taylor & Francis. https://www.tandfonline.com/doi/epdf/10.1080/10095020.2020.1866956?