Learn with Workbooks!
Kinetica comes with easy to follow SQL workbooks that will help you quickly wrap your head around real-time geospatial and time-series analysis.
Try for FREE!
Get started with these workbooks...
Workbooks in Kinetica enable you to load data, query data, build pipelines and output data to maps, visualizations, and other services.

Quickstart
This workbook is an introduction to loading streaming and historical data into Kinetica, performing location analytics and triggering alerts in real time.
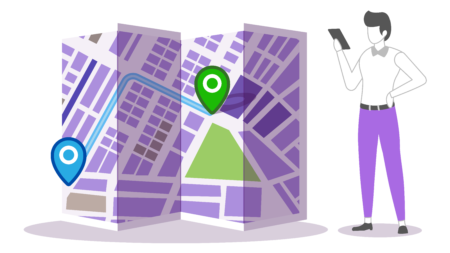
Graph shortest path solver
Use Kinetica’s Graph API to find the best route between different points. From a single source to single destination, to many destinations, and then many sources to many destinations.
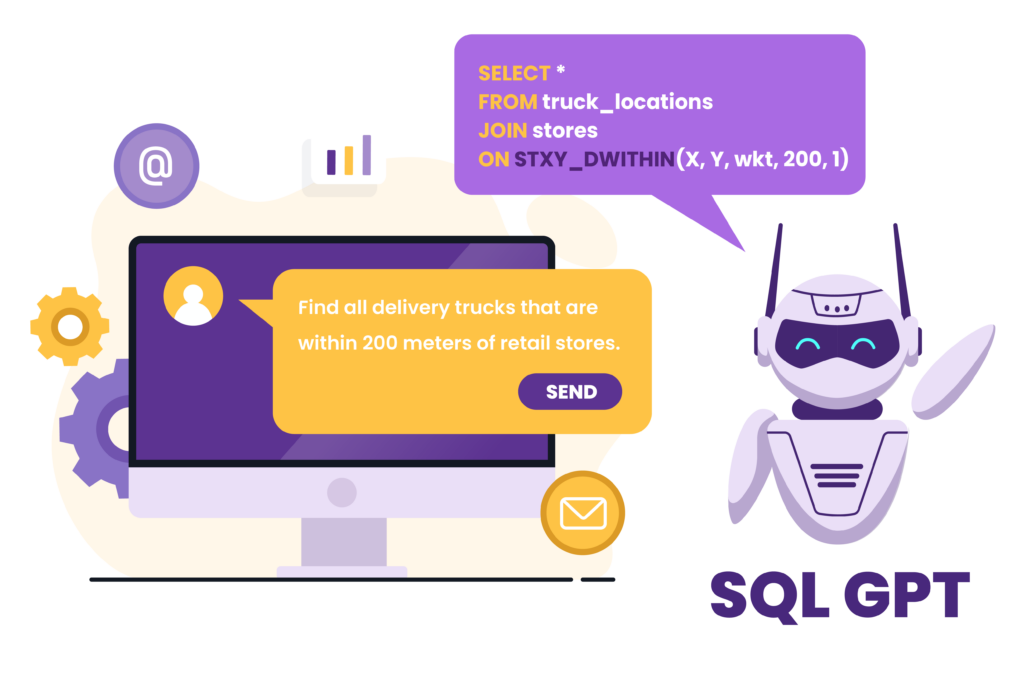
SQL-GPT: Converse with your data
Talk to your data with Kinetica and generative AI. Kinetica’s SQL GPT features make it really easy to unlock insights with just plain English…
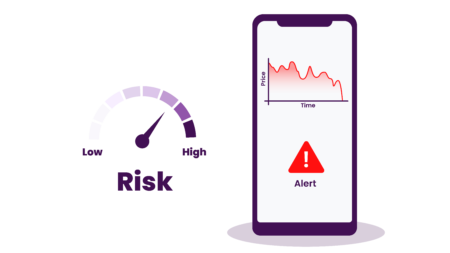
Real-time Monitoring
In this demo, we show how Kinetica can be used to set up a risk monitoring system that automatically triggers alerts based on shifts in portfolio values.
Entity Tracking
Use ‘Tracks’ – a native geospatial object in Kinetica – and other geospatial functions and visualizations to detect when ships intersect with a geofence, loiter in a specific area, or get too close to other ships.
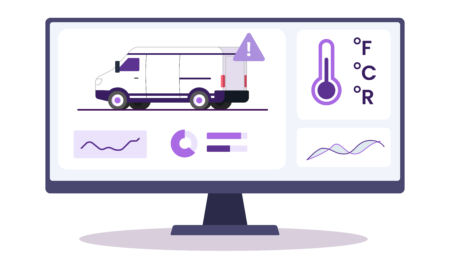
Time-series Joins
Use an ASOF join to build a materialized view of data from GPS and temperature sensors, which are streaming data at different timestamps.
Try these workbooks today:
Join us on Slack
Ask questions, get answers in our community slack channel
We also keep an eye on Stack Overflow for questions tagged with Kinetica
You might also be interested in...
Client Libraries
Build applications on Kinetica using these native API’s
Talk to Us!
The best way to appreciate the possibilities that Kinetica brings to high-performance real-time analytics is to see it in action.
Contact us, and we’ll give you a tour of Kinetica. We can also help you get started using it with your own data, your own schemas and your own queries.

