Kinetica for Logistics

Analyze, Track and Optimize Logistics in Real-Time

Vehicles, location, sensors, personnel, weather, traffic, demand, supply: Kinetica ingests fast-moving data from logistics networks to deliver decision-ready analysis. Some of the world's largest logistics organizations rely on Kinetica real-time analytics capabilities to optimize operations.

Proven With:

USPS Logo

Dynamic Route Optimization

USPS uses Kinetica real-time analytics to dynamically optimize routes and solve some of the complex logistical challenges involved with distributing mail at scale. Analyze stream data from vehicles on the road against vast records of historical events. Optimize routes in real-time. Perform shortest-path analysis, and solve multiple pickup and drop-off requests. Visualize fleet operations in real-time, even with hundreds of thousands of vehicles and tracked items.

USPS Route Optimization Screenshot

Kinetica: The Database for Increasingly Complex Logistics

Logistics operators need to make good decisions based on vast quantities of location related data. Kinetica makes it quicker and easier to collate, fuse, and visualize that data for better analysis, and more responsive event handling.

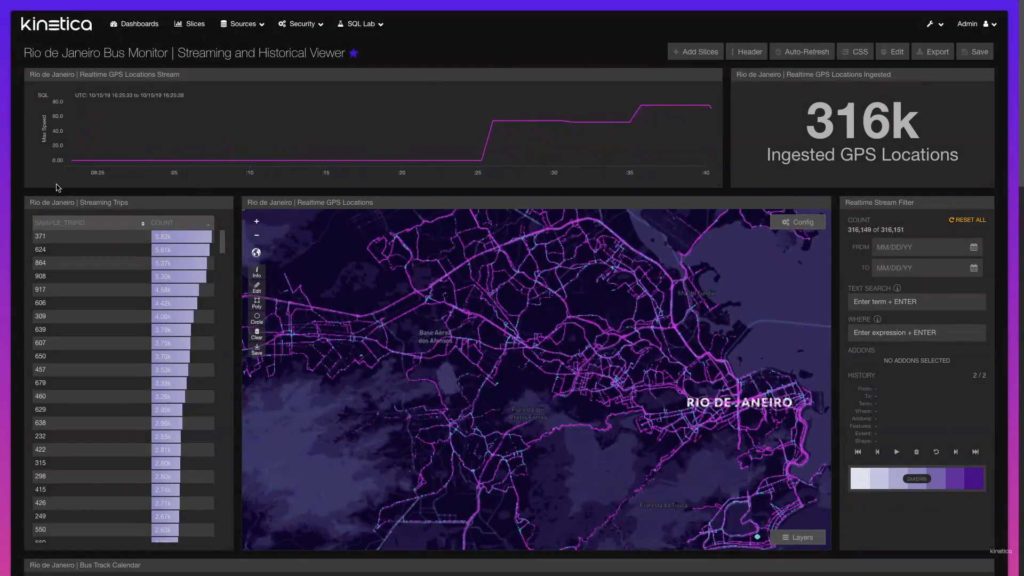
Real-Time Intelligence

Kinetica's lockless architecture, distributed ingestion, and vectorized query enable you to work with numerous sources of spatial and streaming data. Kinetica allows for simultaneous ingest and query, and avoids the need for constant re-indexing and re-aggregations as new data changes the picture.

Kinetica Architecture

Advanced Geospatial Capabilities

Kinetica is capable of analyzing billions of objects as they move in real-time. Over 130 geospatial functions, geo-joins, graph solving and matching makes analytics on spatial and time series data at scale easier and faster.

Geospatial Analytics

Lower TCO, Faster to Deploy

Kinetica's vectorized capabilities enable analysts and engineers to analyze and deploy systems quicker than ever. Vectorized algorithms allow for simpler data structures, which means less time engineering the data, more flexibility for exploring the data, and lower compute costs.

Vectorization Explained

Webinar

Modernizing Real-Time Geospatial Intelligence

State, local and federal governments require the ability to monitor global events to understand their potential impact on their citizens. As threats become more sophisticated, there is a growing imperative to deliver a dynamic common operating picture in real-time, against the full corpus of data, with the ability to detect new patterns across time and space

More Analytics for Logistics

Demand and Inventory Forecasting
Demand & Inventory Forecasting

Ingest, aggregate, and analyze streaming data sources such as connected fleet POS data, and RFIDs in real time. Combine updates with historical data to identify gaps, and ensure demand is met. Tech Recipe

Real-time Supply Chain

Build out real-time supply chain analytics. See interactive visualizations and analysis of automated trip logs for insight into driver safety and efficiency, and perform predictive maintenance analytics.

Try Kinetica Now:

Kinetica Cloud is free for projects up to 10GB

Get Started

Talk to Us!

The best way to appreciate the possibilities that Kinetica brings to high-performance real-time analytics is to see it in action.

Contact us, and we'll give you a tour of Kinetica. We can also help you get started using it with your own data, your own schemas and your own queries.

Contact Us

Frequently asked questions

What logistics data sources does Kinetica fuse in real time?
Kinetica ingests vehicle, location, sensor, personnel, weather, traffic, demand, and supply data from logistics networks and joins them for decision-ready analysis. The result is interactive visualization of fleet operations even with hundreds of thousands of vehicles and tracked items.
How does Kinetica back USPS-style dynamic route optimization?
USPS uses Kinetica's real-time analytics to dynamically optimize routes, perform shortest-path analysis on streaming vehicle data joined with vast historical events, and solve multiple pickup and drop-off requests at scale. A published USPS case study walks through the deployment in detail.
What geospatial features does Kinetica bring to fleet analytics?
Kinetica analyzes billions of moving objects in real time using over 130 geospatial functions plus geo-joins, graph solvers, and map matching. Spatial+time-series analytics at scale becomes expressible directly in SQL.
Can Kinetica drive demand and inventory forecasting alongside fleet ops?
Yes. Kinetica ingests and aggregates connected fleet, POS, and RFID data in real time, then combines updates with historical data to identify gaps and ensure demand is met — an approach proven in a Top-3 retailer inventory replenishment deployment.
How can a logistics team try Kinetica before committing?
Kinetica Cloud is free for projects up to 10 GB, enough to prototype real-time route or inventory analytics on a representative slice of data before scaling.

To provide the best experiences, we use technologies like cookies to store and/or access device information. Consenting to these technologies will allow us to process data such as browsing behavior or unique IDs on this site. Not consenting or withdrawing consent, may adversely affect certain features and functions. Cookie Policy